
Assingment 12: Problem 11
Extra Regression Lines
These are the function I tried to model the data with. I found that none of them were to my satisfaction, so they were not used. I have included a graph with the given trend line and a graph of the residuals produced.
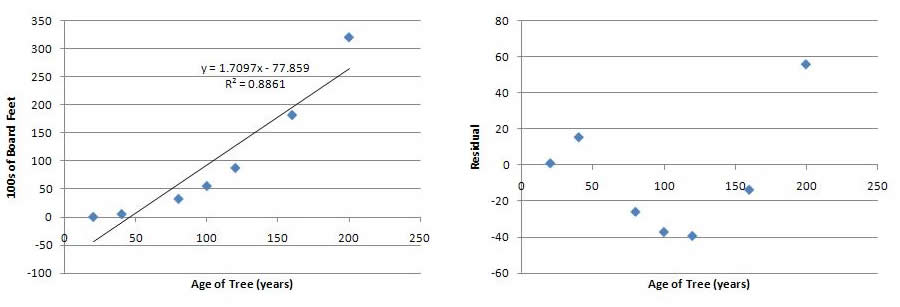
First, I tried a linear function to fit the data. To me, the line clearly does not match the data so to begin with so this is a bad choice of regression line. Here we should note too that the r-squared value here is not as high as the selected quadratic function.Second, the residuals are very large so this regression line is not well suited for the data.
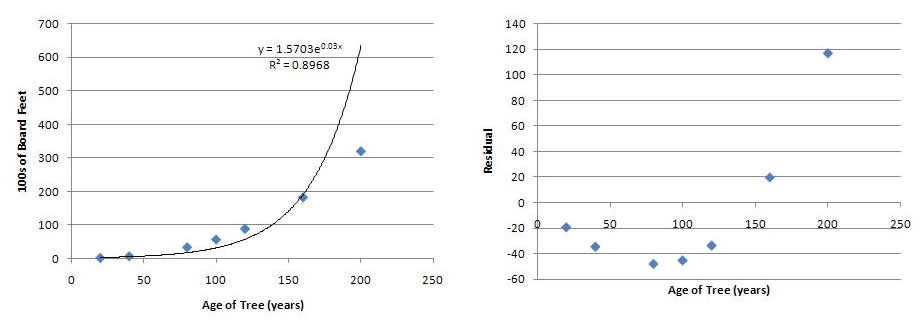
Second, I tried an exponential function. Again, this function does not match the data. Also note that the r-squared value here is not as high as the selected quadratic function. The residual plot also does not work since there is a clear pattern to data.
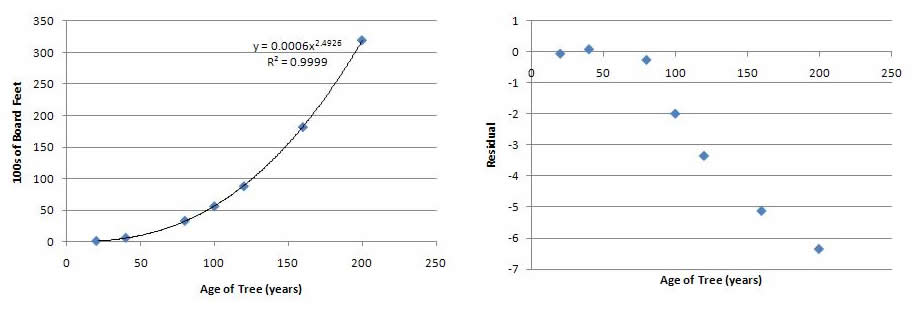
Finally, I tried a power function. This seemed to fit my data very well since the regression line when through all the data points and the r-squared value is very high (in fact higher than my selected function). I then graphed the residuals and noticed that there is a clear pattern to the plot so this function is not ideal. By looking at the equation of the power function though, I realized that a quadratic equation would model the data well since the equation was raised to about 2.5.
To return back to the solution of the problem please click here.